Who Are the Top Industrial Equipment Suppliers in China?
China has become a major source of Industrial Equipment, from construction machinery and machine tools to pumps, compressors, and factory automation. Its supplier landscape includes large manufacturers with international networks and specialist firms serving narrower applications. That variety can make a shortlist difficult to build. A familiar brand name does not guarantee the right machine, service coverage, or delivery schedule for every project.
This guide explores companies often considered among China’s leading industrial suppliers and the strengths buyers may want to examine. It looks beyond product catalogs to practical details: manufacturing focus, technical documentation, customization options, spare-parts access, and after-sales support. For example, a buyer comparing two pumps should check the stated operating range, material specifications, maintenance requirements, and availability of replacement seals. Small details matter. Supplier rankings can also be imperfect, since “top” depends on equipment type, budget, location, and project needs. Company claims should be checked against current product data, relevant certifications, and direct discussions with the supplier. Readers should treat this overview as a starting point, not a substitute for technical review or independent due diligence. The aim is to make supplier comparisons clearer and help businesses ask more informed questions before requesting quotations or placing orders.
How China’s Industrial Equipment Sector Is Defined and Classified
China’s industrial equipment sector is not one neat category. It covers machines that make products, move materials, generate power, and support construction. For buyers comparing suppliers, classification helps reveal what a company actually builds. A factory producing packaging lines differs greatly from one making mining pumps, even if both describe themselves as machinery manufacturers.
A practical view groups equipment by function: production machinery, power and electrical systems, construction and mining equipment, logistics equipment, and measuring or control instruments. Another useful lens is the customer’s industry, such as food processing, metals, chemicals, or agriculture. These categories overlap. A conveyor may serve a warehouse, a mine, or an assembly plant. The boundary is not always tidy.
Supplier profiles also vary by role. Some design complete production lines; others specialize in motors, valves, bearings, or custom-fabricated frames. That distinction matters. A buyer should check technical drawings, material specifications, test records, service coverage, and spare-part lead times. A small detail, such as the stated operating temperature, can change whether a component suits a real production floor. Not always. Classification systems and company descriptions may use different terms, so verify the actual product range rather than relying on a label alone.
IFR: China Installed 276,288 Industrial Robots in 2023—51% of Global Total
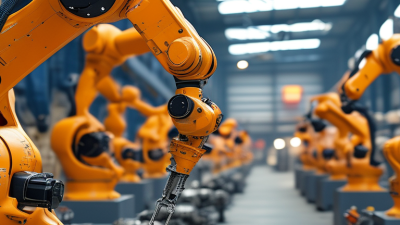
China’s industrial-equipment suppliers operate in a market defined by exceptional scale. The International Federation of Robotics (IFR), in World Robotics 2024, reported 276,288 industrial robots installed in China during 2023. That represented 51% of worldwide installations. One number changes the picture. China’s annual installations exceeded those of every other country by a wide margin, making local production capacity and service coverage important factors for buyers.
The IFR also reported that Chinese suppliers held 47% of their home market in 2023, up from 28% in 2017. Its robot-density figures put China at 470 robots per 10,000 manufacturing employees, evidence of deepening factory automation. Still, scale is not quality. Buyers should compare a supplier’s experience with the actual task: welding, material handling, or assembly. Ask for cycle-time results, uptime records, spare-parts availability, and support response times. A robot cell may look efficient on paper, yet small integration delays can slow a production line. The figures reveal market momentum, not a guarantee that every supplier fits every factory.
Leading Suppliers by Segment: Sany, XCMG, Zoomlion, and Inovance
China’s industrial-equipment market is easier to understand by segment than through one overall ranking. Heavy-equipment manufacturers supply construction sites with excavators, cranes, road machinery, and concrete systems. Their value shows in practical details: lifting capacity, fuel consumption, parts availability, and uptime in dusty, demanding conditions. A machine may look strong on paper but disappoint when technicians wait days for a replacement part. That matters.
Another segment focuses on factory automation, including variable-frequency drives, servo systems, controllers, and motion components. These products are judged less by size than by control stability, integration effort, and commissioning support. Buyers can compare service coverage, software compatibility, spare-part lead times, and technical documentation—not just catalog specifications. Request a trial with the actual motor, load, and production cycle. Still, a short test cannot reveal every issue after months of heat, vibration, and shift changes. Segment-based comparisons offer a useful starting point, but plant-specific trade-offs remain.
How to Compare Suppliers by Revenue, R&D, Exports, and Market Share
Who Are the Top Industrial Equipment Suppliers in China?
Revenue is a useful starting point, but compare suppliers within the same equipment category. China Machinery Industry Federation data put the machinery sector’s 2023 operating revenue at about RMB 31.8 trillion. That figure describes a broad industry, not an individual supplier’s performance. Check audited annual reports for equipment revenue, year-on-year growth, margins, and dependence on a few large customers. Numbers need context. A high turnover can reflect a wide product mix, not stronger engineering or service.
R&D comparisons should use R&D spending as a share of revenue, alongside technical staff, patents, and product upgrades. The National Bureau of Statistics reported national R&D intensity of 2.64% in 2023; this is context, not a supplier benchmark. For export capability, review overseas sales, shipment destinations, warranty support, and delivery records. China Customs reported mechanical and electrical exports of RMB 13.92 trillion in 2023, a broad category rather than equipment-only data.
Market share can offer a closer comparison: IFR’s World Robotics 2024 report says domestic suppliers held 47% of China’s industrial robot market in 2023. This is one product segment. I would still check the report’s scope and the supplier’s own segment data before treating share as proof of reliability.
What Buyers Should Check: Certifications, Service Networks, and Total Cost of Ownership
A supplier’s certificate is a starting point, not proof that every machine meets your needs. ISO’s 2022 Survey recorded more than 1.26 million valid ISO 9001 certificates worldwide. Ask to see the current certificate, its scope, and the issuing body; check that the named factory and relevant equipment are covered. Then compare inspection records, material traceability, and test results for the exact model. A polished document can still leave gaps. Ask who handles commissioning, warranty claims, and urgent repairs in your region, and request realistic response times in writing.
Service coverage matters most when a line stops. Check local technician availability, spare-parts stock, remote support, and the time needed to ship common wear parts. Ask for examples of service response times, not just a map of service offices. Then calculate total cost of ownership: purchase price, energy, consumables, planned maintenance, downtime, and operator training. The IEA’s Energy Efficiency 2023 report estimates industry uses about 37% of global energy, making equipment efficiency a material cost factor. Request measured power consumption under your operating conditions, rather than relying only on catalogue figures. Compare expected annual costs over the same period and production volume. The assumptions may be imperfect; write them down and test the most expensive ones.
What Buyers Should Check: Supplier Certifications, Service Networks & Total Cost of Ownership
Edition years of selected ISO management-system standards relevant to industrial equipment suppliers
The chart shows the edition year as years after 2010. These standards address different management systems; they do not by themselves certify a specific product or guarantee supplier performance. Verify certificate validity and scope, local service coverage and response times, and compare total cost of ownership—including purchase, installation, energy, maintenance, spare parts, and downtime.